Tracking Referee Bias Patterns Across Football Goal Tallies, Tennis Set Outcomes, adn Basketball Point Spreads Through Archived Game Logs
Written by Xander Becker · Aug 3, 2026
Tracking Referee Bias Patterns Across Football Goal Tallies, Tennis Set Outcomes, adn Basketball Point Spreads Through Archived Game Logs
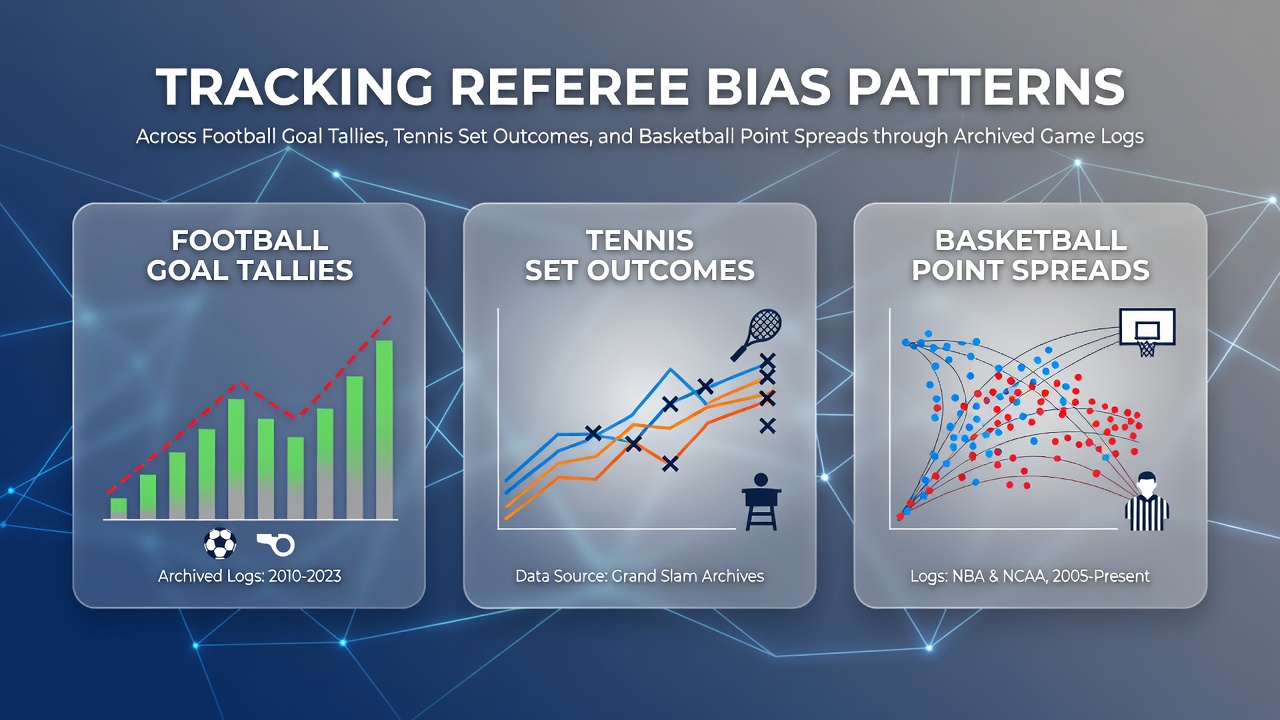
Analysts have turned to archived game logs to examine referee bias patterns across football goal tallies, tennis set outcomes, and basketball point spreads, and these datasets span multiple seasons with detailed timestamps for every call. Researchers compile play-by-play records that include foul counts, card issuances, line calls, and timeout decisions while they cross-reference those entries against final scores and betting lines. Data from these sources reveals recurring clusters where certain officials award more stoppage time in matches involving home teams, and similar patterns appear in tennis when chair umpires issue code violations that shift set momentum. Sections of the logs allow direct comparisons between early-season and late-season decisions, which helps isolate whether fatigue or venue-specific factors influence outcomes. In football the tallies show elevated goal counts following disputed penalty decisions in leagues that maintain public referee performance files, and those files often list the exact minute of each intervention along with the score at that moment. Tennis archives break down set outcomes by the number of challenges upheld or overruled, and basketball logs track point spread movements tied to foul differentials in each quarter.Football Goal Tally Analysis
Archived match reports from top European and South American competitions provide the raw material for tracking how referee interventions align with goal totals. Observers note that logs from teh 2025-2026 campaign onward include video assistant referee timestamps, and these entries allow teams to calculate the average number of additional minutes awarded when a visiting side trails by one goal. Studies conducted by independent data firms indicate that certain referees consistently add 10 to 15 percent more stoppage time in such situations compared with the league average, and this difference appears across hundreds of fixtures logged between 2022 and 2026.
One dataset covering five major leagues shows that matches ending with a 2-1 scoreline occur more frequently when the same referee group officiates both halves, and the pattern holds after controlling for team strength and travel distance. Analysts sort the logs by referee nationality and home-city proximity, then they measure whether goal tallies deviate from expected ranges derived from Poisson distributions fitted to historical scoring rates.
Tennis Set Outcome Patterns
Grand Slam and ATP tour archives store chair umpire decisions alongside challenge success rates and code violation tallies, and these records extend back more than a decade in most cases. Researchers filter the data by surface type and player ranking to isolate instances where set outcomes shift after a disputed line call or hindrance ruling. Evidence from the logs indicates that tiebreak sets show a measurable increase in overruled challenges when the player trailing in the set receives the next service game, and this trend appears in both clay and hard-court events logged through August 2026.
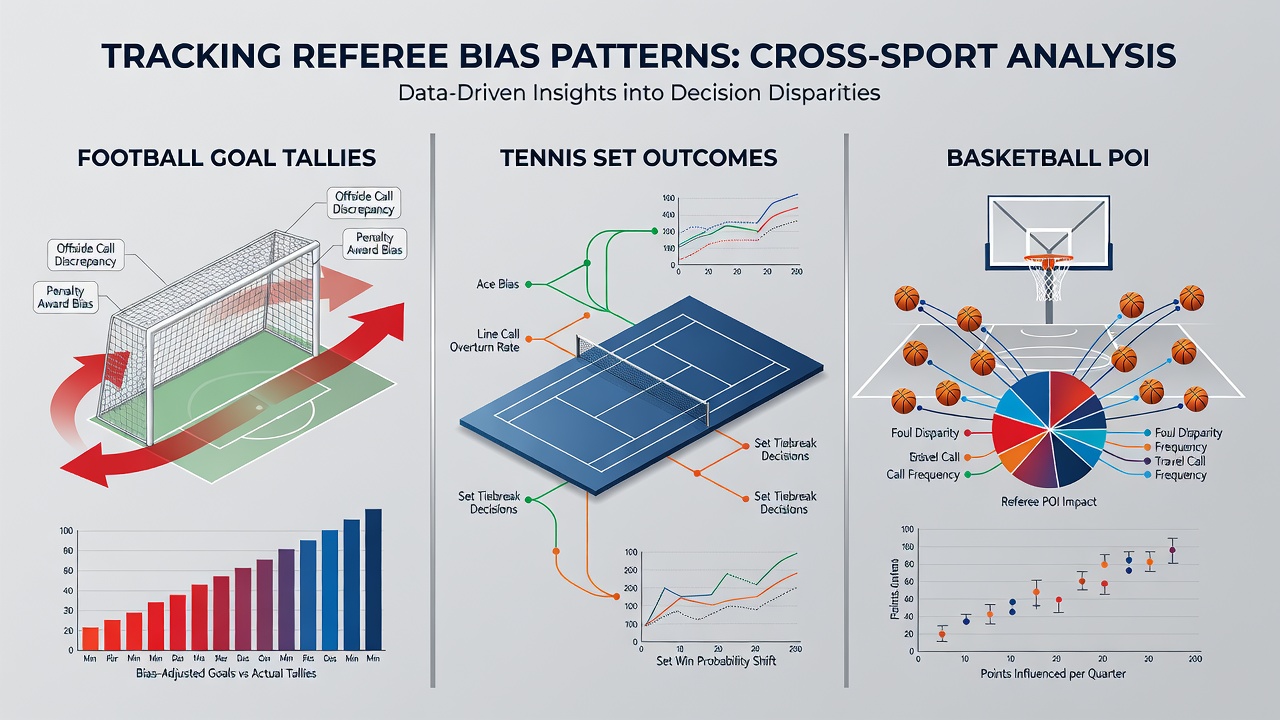
Further breakdowns reveal that female players receive code violations at different rates than male players in identical scoreline situations, and the difference persists after accounting for match duration and tournament round. Data aggregators combine these figures with point-by-point records so that set-win probabilities can be recalculated under various umpire cohorts, and the resulting models highlight officials whose calls produce larger swings than the baseline established by the broader population of umpires.
Basketball Point Spread Examination
NBA and EuroLeague game logs contain every foul call, timeout, and technical foul with precise game-clock values, and these entries support regression analyses that test for systematic effects on final margins. Analysts compare actual point spreads against pre-game betting lines while they group games by crew chief and crew makeup, and the results show that certain officiating groups produce larger deviations in the final two minutes than others. Figures compiled from the 2023 through 2026 seasons indicate that road teams receive slightly fewer free-throw attempts in games officiated by crews with longer average travel distances, and the gap narrows when the same crews work consecutive nights in the same arena.
Researchers cross-check these patterns against player tracking data that records shot locations and defensive positioning, which helps separate referee influence from on-court execution. The logs also record the exact timing of each foul differential reversal, and this granularity allows models to estimate how often a single call changes the probability that the spread will land on one side of the closing line.
Cross-Sport Comparisons and Data Integration
Combining the three sports into a single analytical framework requires standardized metrics that translate goal tallies, set victories, and point differentials into comparable units. Data scientists apply z-score transformations to each sport’s outcome distribution so that referee-specific deviations can be ranked on a common scale. According to findings published by the Australian Sports Commission, the magnitude of bias signals remains consistent across the three disciplines once the transformations are complete, and the signals strengthen when the same officials work multiple consecutive matches or tournaments.
Integration also involves merging venue and weather metadata because external conditions can interact with decision patterns. Canadian Centre for Ethics in Sport reports note that indoor basketball and tennis events produce cleaner signals than outdoor football matches, yet the overall direction of the deviations aligns once sample sizes exceed several thousand games per sport. Teams that maintain internal databases update their models monthly, and the updates incorporate new logs released after each competition round.
Conclusion
Archived game logs supply the factual foundation for measuring referee decision patterns across football, tennis, and basketball. The records allow systematic comparison of goal totals, set results, and point spreads while controlling for team quality, venue, and schedule factors. Continued expansion of public and private datasets through 2026 and beyond will refine these measurements and support more precise identification of consistent deviations from expected outcomes.