Opening Week Surges Versus Season-End Fatigue: Tracking Odds Evolution in Basketball Leagues and Tennis Tours
Written by Xander Schmitz · Aug 5, 2026

Opening Week Surges Versus Season-End Fatigue: Tracking Odds Evolution in Basketball Leagues and Tennis Tours
Betting markets in professional basketball leagues and tennis tours display measurable shifts in odds as seasons unfold, with early-week momentum often giving way to late-stage adjustments driven by accumulated physical demands. League schedules place heavy emphasis on opening periods where fresh rosters generate stronger results, and data from multiple seasons shows bookmakers respond by tightening lines on favored sides during those stretches while loosening them later when fatigue indicators rise. Observers tracking NBA regular-season fixtures alongside ATP and WTA events note that these patterns repeat across different years and surfaces, creating consistent windows for odds movement that reflect both statistical trends and real-time player availability reports.
Basketball League Patterns at Season Start and Finish
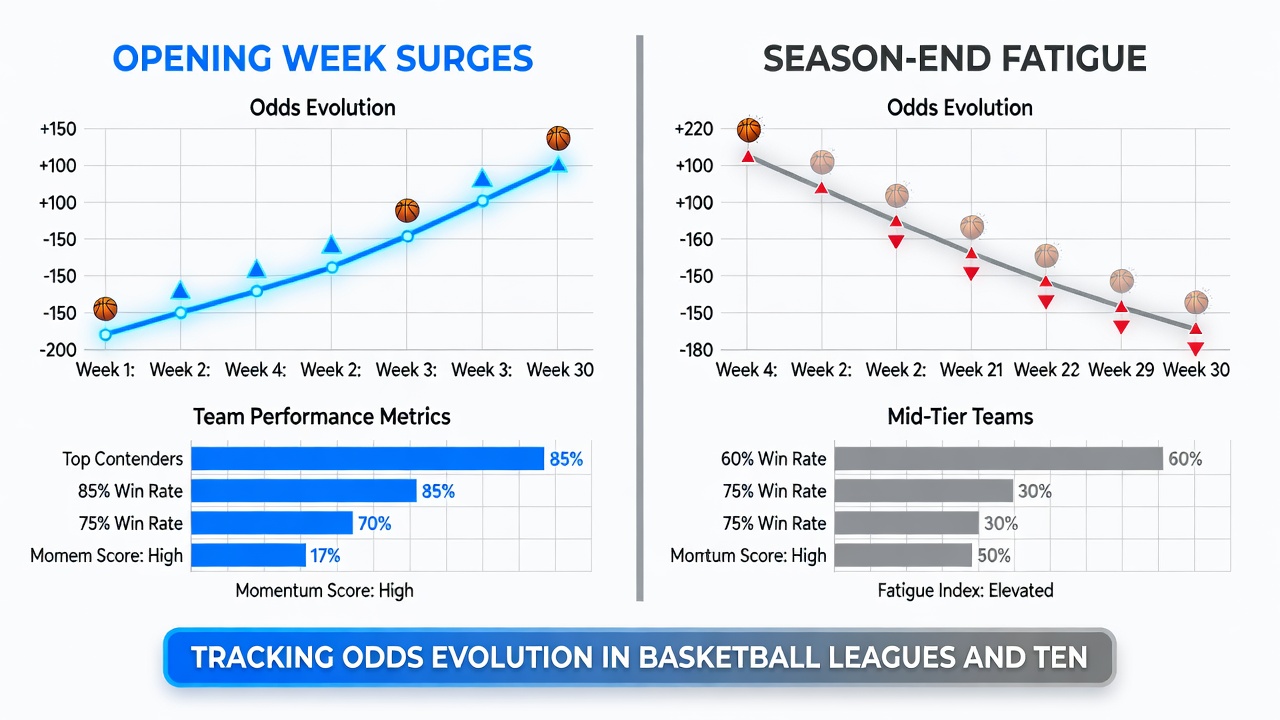
NBA teams frequently post elevated win rates in the first two weeks of the regular season because training camps allow concentrated preparation time without the wear of back-to-back games, and historical box-score aggregates confirm higher shooting percentages and defensive efficiency metrics during that window. Bookmakers adjust opening-week spreads accordingly, often listing favorites at narrower margins than their season-long averages would suggest, while totals markets reflect the faster pace that characterizes rested lineups. By contrast, the final month of the schedule brings compressed travel, injury accumulation, and load-management protocols that depress scoring outputs; figures released by league tracking systems show a measurable decline in points per game and rebounding rates that prompts oddsmakers to widen spreads and lower over/under thresholds. European basketball competitions such as the EuroLeague mirror similar trajectories, although their shorter calendars compress the fatigue effect into the closing rounds where playoff positioning already influences rotation decisions.
Tennis Tour Performance Trajectories Across Surfaces
ATP and WTA calendars begin with hard-court swings in Australia and the Middle East where players who avoided off-season injuries post higher first-serve percentages and conversion rates on break points, and these early surges translate into shorter odds for seeded competitors during initial tournaments. Data compiled across multiple Grand Slam qualifying draws and Masters 1000 events indicate that serve-hold percentages drop by measurable margins once the European clay season transitions into the grass-court block and then the North American hard-court swing, a progression that coincides with cumulative match counts exceeding thirty for many top-ranked athletes. August 2026 marks the approach of the US Open where late-summer scheduling overlaps with prior hard-court commitments, and betting platforms historically widen odds on players logging heavy summer workloads while shortening lines on those who managed rest periods between events. Observers following ranking points distributions note that late-season qualifiers often outperform expectations against higher-ranked opponents precisely because early-round fatigue has already eliminated several names from contention.
Odds Movement Mechanisms and Data Inputs
Oddsmakers integrate player-tracking metrics, travel logs, and medical bulletins when recalibrating lines between opening weeks and season conclusions, and the resulting adjustments appear in both pre-match and in-play markets across basketball and tennis offerings. In basketball, quarter-by-quarter splits reveal that opening-week teams maintain higher fourth-quarter scoring margins, prompting live-betting operators to react faster when spreads move after halftime. Tennis markets respond to set-level fatigue signals such as unforced-error spikes in deciding sets, and platforms adjust tie-break odds more aggressively once a player has contested multiple five-set matches within a fortnight. Industry reports from the Nevada Gaming Control Board document how these micro-adjustments accumulate into broader seasonal trends that influence accumulator construction, while research published by the University of Sydney Centre for Gambling Research examines cross-sport correlations between workload spikes and betting-line volatility in comparable individual and team formats.
Comparative Analysis Across Leagues and Tours
Direct comparisons between NBA and ATP/WTA datasets highlight that basketball squads experience more abrupt drops in efficiency once the schedule exceeds seventy games, whereas tennis players show steadier but cumulative declines tied to consecutive tournament participation. Yet both domains produce parallel odds-evolution signatures where early-season favorites receive shorter prices that lengthen as the calendar advances, and underdog lines tighten correspondingly during final weeks. Australian regulatory filings on sports-wagering volumes indicate elevated handle on late-season unders in basketball while tennis markets see increased activity around lower-set totals once the calendar reaches August and September. These patterns persist across different seasons because the underlying physiological and scheduling constraints remain constant regardless of specific rosters or rankings.
Conclusion
Tracking odds evolution from opening-week surges to season-end fatigue in basketball leagues and tennis tours reveals repeatable market responses rooted in documented performance data rather than isolated results. League schedules and tour calendars impose structural demands that betting operators incorporate into line construction, producing measurable shifts that repeat across seasons and geographies. Continued collection of workload statistics and medical availability updates will sustain these observable trends as future campaigns unfold.