How Travel Fatigue Metrics Quietly Influence Betting Lines in Major Leagues
Written by David Sullivan · Sep 15, 2026
How Travel Fatigue Metrics Quietly Influence Betting Lines in Major Leagues
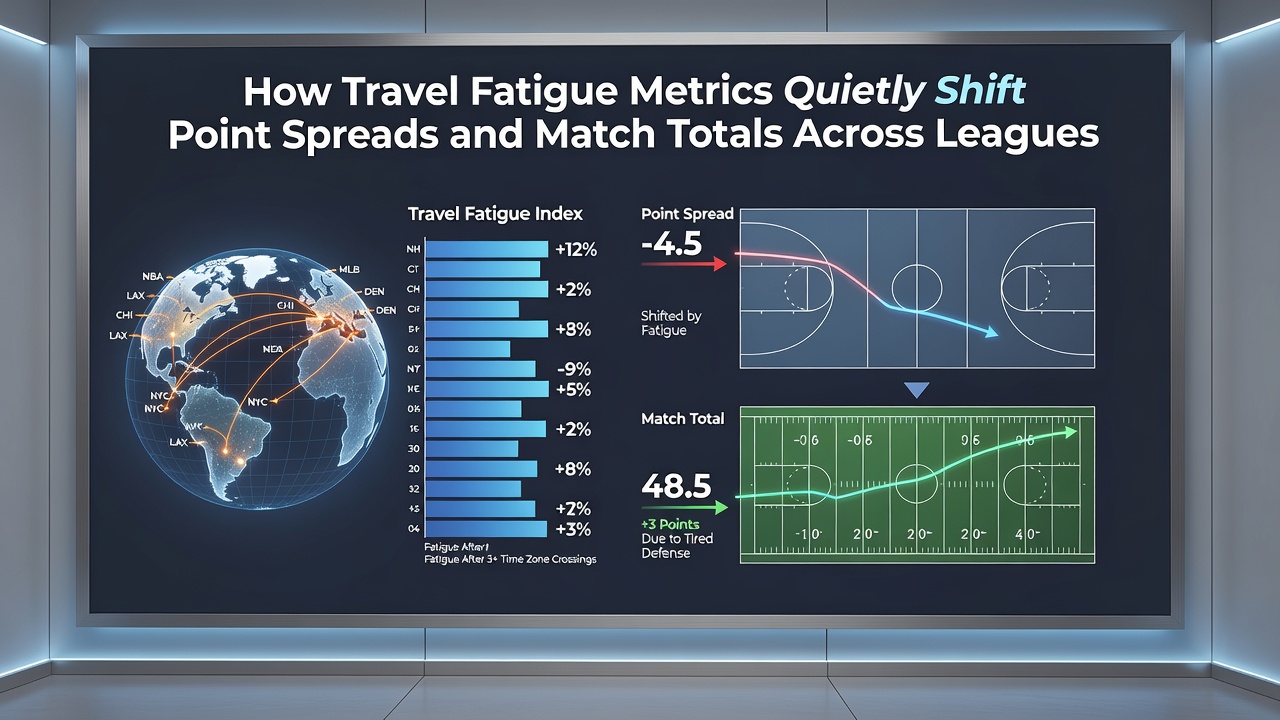
Travel fatigue has emerged as a measurable factor that analysts track when evaluating point spreads and over/under totals across professional leagues, and data from multiple seasons demonstrates consistent patterns where teams crossing multiple time zones or logging high mileage see shifts in performance metrics. Researchers at institutions focused on sports physiology have compiled datasets that link recovery intervals, circadian disruption, and cumulative travel distance to changes in scoring efficiency and defensive output. These metrics receive integration into betting models because they provide quantifiable edges that bookmakers adjust for when setting lines, particularly in schedules packed with cross-country or international fixtures.
Measuring Travel Fatigue Through Established Metrics
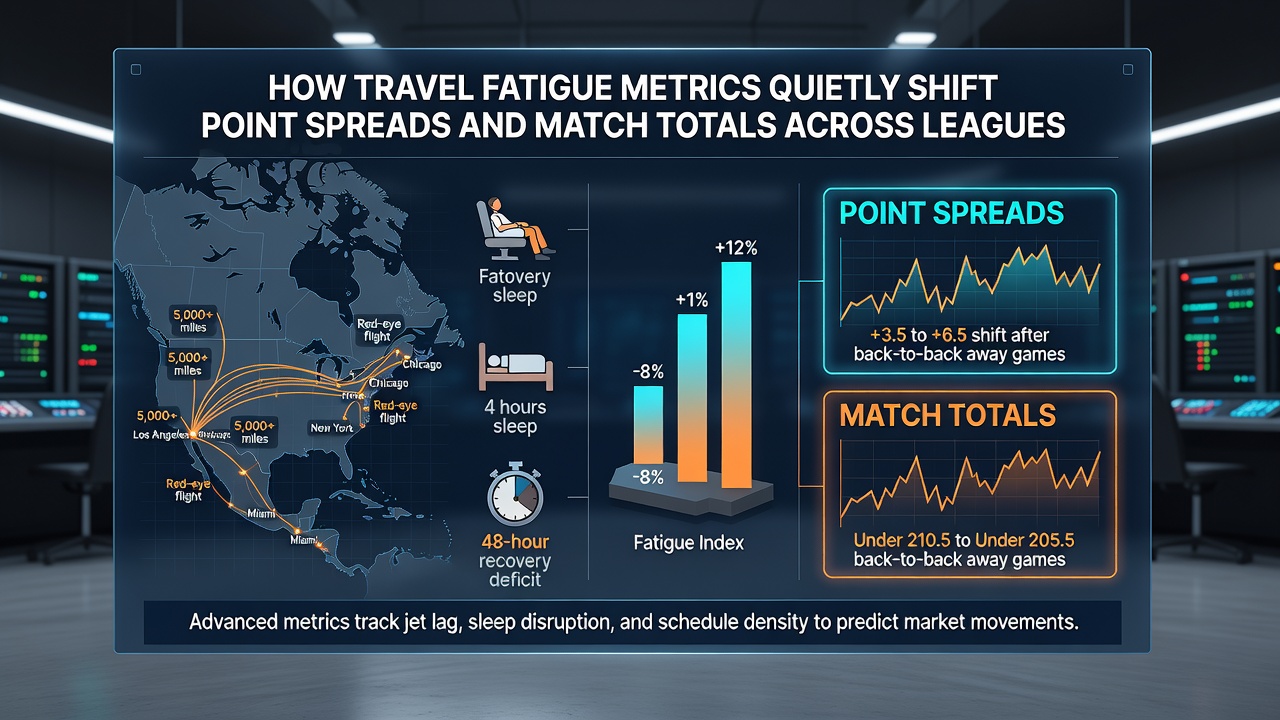
Analysts calculate travel fatigue using variables such as total air miles, number of time zones crossed, days between games, and sleep disruption scores derived from wearable data, and organizations like the Australian Institute of Sport have published frameworks that standardize these calculations for team performance evaluations. When teams accumulate over 5,000 miles in a two-week span, studies show reductions in field goal percentages and increased turnovers in basketball contexts, while soccer leagues record similar drops in high-intensity running distances. These figures get cross-referenced with historical game logs to identify where spreads widen by half a point or totals drop by two to three points on average.
September 2026 schedules in leagues such as the NBA and European football competitions introduce early-season travel clusters that amplify these effects, with several teams facing back-to-back transcontinental flights within the first month. Data indicates that squads with limited recovery windows post-travel post lower offensive ratings, prompting oddsmakers to shade totals downward in affected matchups.
League-Specific Impacts on Point Spreads
In the NBA, teams traveling from the West Coast to East Coast games exhibit a documented tendency to cover spreads at lower rates when playing the second leg of a back-to-back, according to aggregated season data compiled by sports analytics groups. The effect compounds during stretches with three games in four nights, where defensive efficiency metrics decline measurably and spreads adjust by 1.5 to 2.5 points in favor of the home side. Similar patterns appear in Major League Baseball, where starting pitchers logging extensive travel show elevated earned run averages in subsequent starts, influencing run totals and run-line spreads.
Football leagues in Europe track comparable variables, with clubs flying between Champions League midweek matches and domestic fixtures experiencing elevated injury rates that alter expected goal models and handicap lines. Research from Canadian university sports science departments highlights how Atlantic crossings produce the strongest effects, with teams showing 8-12% reductions in key performance indicators that translate directly into adjusted betting markets.
Data Patterns in Match Totals
Match totals respond to fatigue indicators because scoring outputs decrease when teams operate below peak physiological capacity, and league-wide tracking reveals that games involving high-travel teams land under the posted total at rates exceeding 52% in recent seasons. In cricket's shorter formats, touring sides crossing hemispheres post lower run rates in the first two matches, which influences over/under markets on boundaries and totals. Observers note that these patterns hold across datasets from the past five years, with adjustments appearing most pronounced in the opening weeks of new campaigns.
Industry reports from European gaming associations document how operators incorporate real-time travel data feeds to refine totals, particularly when weather or schedule changes extend recovery demands. The result appears in tighter lines for high-mileage road teams and expanded margins for rested home squads.
Integration Into Modern Betting Models
Betting platforms now embed travel fatigue algorithms alongside traditional stats like offensive efficiency and defensive ratings, creating layered models that shift spreads in real time as schedules finalize. Academic papers from institutions in the United States and Australia demonstrate that adding circadian and mileage variables improves predictive accuracy by 3-5 percentage points over baseline models. Those models flag situations where a team crosses four or more time zones within 72 hours, prompting line movements that reflect reduced scoring potential and altered point differentials.
Regulatory bodies in multiple regions, including data oversight groups in Canada and the EU, require transparency around such factors when operators publish odds, which encourages standardized reporting of fatigue-related adjustments. This transparency allows bettors and analysts to access aggregated datasets that highlight recurring edges in specific travel scenarios.
Conclusion
Travel fatigue metrics have become embedded in the analytical processes that shape point spreads and match totals because they deliver repeatable correlations with performance outcomes across basketball, baseball, soccer, and cricket. As schedules evolve and data collection expands through wearables and tracking systems, these variables continue to influence how lines form and adjust in major leagues worldwide. The patterns documented in season-long studies provide objective inputs that models use to refine expectations without relying on subjective assessments.